
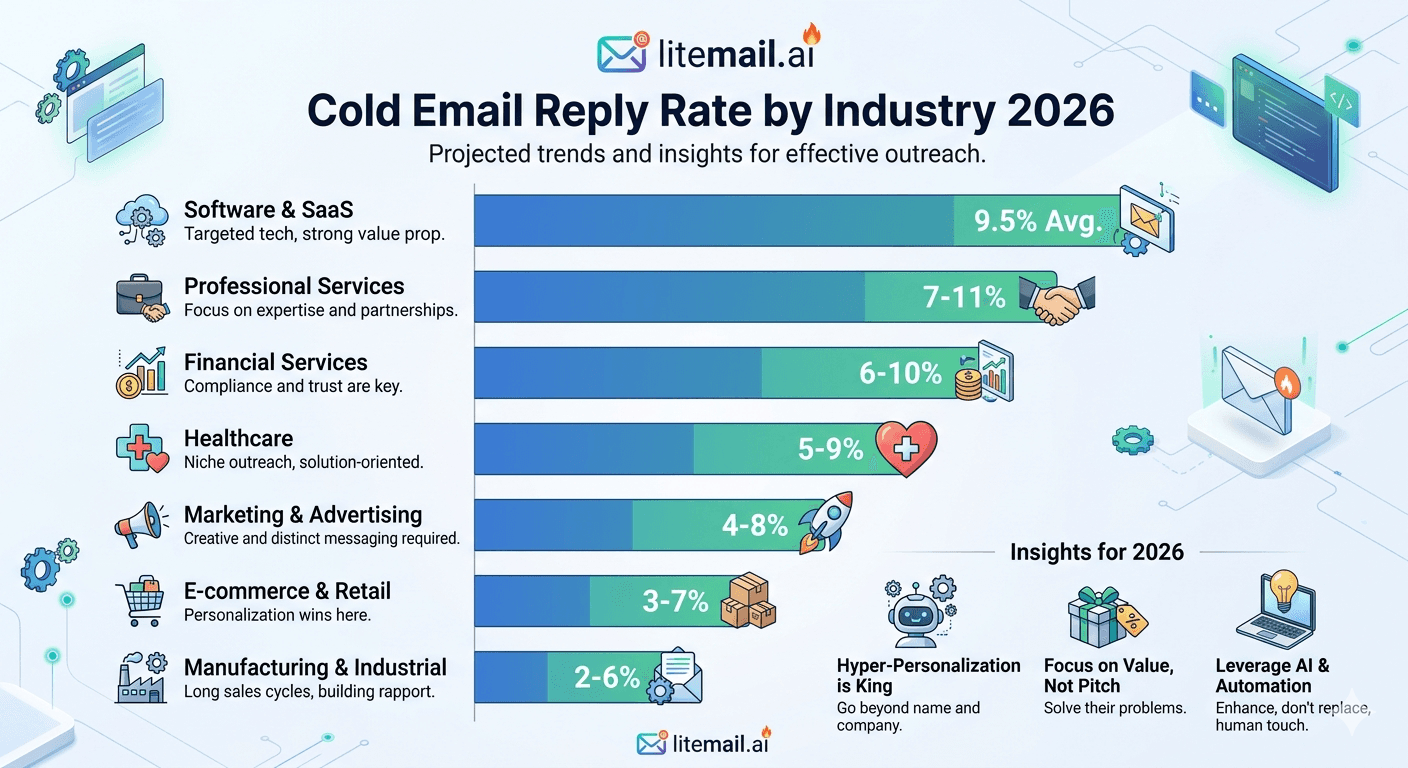
A 2% reply rate that's disappointing in one industry is exceptional in another. "What reply rate should I be getting?" only has a useful answer with context — industry, ICP precision, infrastructure quality, and sequence structure all shift the number materially. Here are the real benchmarks by vertical, based on campaigns running through Litemail infrastructure in 2026, with the variables that determine where you land in each range.
Cold Email Reply Rate Benchmarks by Industry
Industry | Average Reply Rate | Top Quartile | Key Variable |
|---|---|---|---|
Recruiting / Staffing | 4–8% | 8–12% | High pain intensity — candidates and clients respond when specific |
B2B SaaS (SMB buyer) | 3–6% | 6–10% | Competitive market — specificity is the differentiator |
Marketing / Ad Agencies | 3–6% | 5–8% | Familiar with outreach — respond when the offer is genuinely relevant |
IT / MSP Services | 3–5% | 5–8% | Decision makers are reachable; pain is acute and specific |
Financial Services | 2–4% | 4–6% | Compliance-aware culture — longer decision cycles |
Manufacturing / Industrial | 2–4% | 4–7% | Lower email volume culture; high quality when relevant |
B2B SaaS (Enterprise buyer) | 1–3% | 3–5% | Harder to reach, longer cycle — but conversation quality is higher |
Legal Services | 1–3% | 3–5% | Conservative communication norms — referrals often work better |
Healthcare / Medtech | 1–2% | 2–4% | Regulatory caution; procurement complexity; gatekeepers everywhere |
E-commerce Brands | 2–4% | 4–7% | Founders and DTC marketers respond quickly when the offer is specific |
Real Estate | 3–5% | 5–9% | Transactional mindset — high responsiveness to relevant propositions |
Cybersecurity | 2–4% | 4–6% | Security-aware audience — email authentication signals matter more here |
Why Reply Rates Vary So Much by Industry
Three structural factors drive the cross-industry differences — not just copy quality.
Outreach saturation: Industries that receive high volumes of cold email develop lower per-email response rates regardless of message quality. B2B SaaS buyers receive 15–40 cold emails per week in many cases. Industrial manufacturing buyers may receive 3–5. The manufacturing buyer's lower saturation produces higher per-message response rates even when the messaging is less refined.
Buying process complexity: Industries with committee buying processes and long procurement cycles (enterprise SaaS, healthcare, government-adjacent) produce lower immediate response rates — not because they're uninterested, but because the response path is longer. A 1.5% reply rate from a healthcare executive audience can still produce high-value conversations; the same rate from a SaaS SMB audience is a signal that something is structurally wrong.
Email culture: Some industries communicate primarily via phone (manufacturing, construction, real estate) — email is a secondary channel. Others are email-native (SaaS, agencies, tech). Email-native industries respond faster but also filter more aggressively.
How Infrastructure Quality Moves Industry Reply Rates
Industry benchmarks assume a well-configured cold email setup. Fresh unwarmed inboxes cut these numbers roughly in half across all industries — because inbox placement, not message quality, becomes the limiting factor.
Industry | Fresh Inbox Reply Rate | Litemail Pre-Warmed Reply Rate | Infrastructure Lift |
|---|---|---|---|
Recruiting / Staffing | 1.5–3% | 4–8% | 2.5–4x |
B2B SaaS (SMB) | 1–2.5% | 3–6% | 2–3x |
Financial Services | 0.5–1.5% | 2–4% | 2–4x |
Manufacturing | 0.8–2% | 2–4% | 2–3x |
The infrastructure lift is consistent across industries — moving from 40–60% primary inbox placement (fresh inbox) to 94–96% (Litemail pre-warmed) produces 2–4x reply rate improvement regardless of vertical. The absolute numbers differ by industry; the multiplier from clean infrastructure is roughly constant.
What Moves Reply Rates Within an Industry
Within any given industry, four variables determine where a campaign lands in the benchmark range:
ICP precision: Broad ICP ("VP Sales at SaaS companies") consistently produces lower rates than narrow ICP ("VP Sales hired in the last 45 days at Series A–B SaaS companies with 30–150 employees"). The trigger component is the single highest-impact targeting variable.
First sentence specificity: A generic first sentence that could apply to 10,000 people is the most common reason campaigns in high-potential industries produce bottom-quartile rates. Specific references to the recipient's situation, company, or recent event move reply rates 1–3 percentage points.
Email length: Emails over 120 words consistently underperform across all industries. The optimal length for first-touch cold email is 60–90 words. Shorter is almost always better.
CTA friction: Asking for a demo or proposal meeting in the first email kills reply rates in every industry. A 15-minute call or a single yes/no question produces 2–4x higher response rates on equivalent copy.
Seasonal Reply Rate Patterns by Industry
Reply rates vary significantly by season within each vertical. Understanding these patterns prevents campaigns from launching into low-responsiveness windows.
Accounting/Financial Services: Lowest in Jan–Apr (tax season). Highest in May–Sep.
E-commerce / DTC: Lowest in Nov–Dec (holiday peak). Highest in Jan–Mar and Jul–Aug.
B2B SaaS: Consistently responsive year-round with slight dips in Aug and Dec. Budget cycles create a Q3 spike for annual planning tools.
Healthcare: Lowest in Dec–Jan. Conference season (Mar–May) produces higher responsiveness from leadership.
Manufacturing: Lowest in Dec (plant shutdowns). Highest in Feb–May and Sep–Oct.
Infrastructure That Hits the Top of Every Industry Range — Litemail
Industry reply rate benchmarks assume clean infrastructure. Litemail pre-warmed inboxes at 94–96% primary inbox placement move every industry campaign to the top of its range. $4.99/inbox.
Get Pre-Warmed Inboxes from $4.99 →
94–96% placement · Good/High Postmaster · Dedicated US and EU IPs · No minimum order
About Litemail — Litemail provides pre-warmed Google Workspace and Microsoft 365 inboxes for cold email outreach. From $4.99/inbox with automated DNS, dedicated US and EU IPs, and full admin access. View pre-warmed inbox plans →
Related reading:
Cold Email Open Rate Benchmarks 2026 · Metrics Before vs After Pre-Warmed · GWS Cold Email Reply Rate 2026 · Improve Cold Email Open Rate · Cold Email Campaign Audit
Key Takeaways
Recruiting/staffing leads all industries at 4–8% average reply rates. B2B SaaS (SMB) and marketing agencies follow at 3–6%. Healthcare and enterprise B2B sit at the lower end (1–3%) — not because cold email doesn't work there, but because buying cycles are longer and response paths are more complex.
Infrastructure quality is a consistent multiplier across industries. Moving from fresh inboxes to Litemail pre-warmed inboxes (94–96% placement) produces 2–4x reply rate improvement in every vertical without changing copy, list, or sequence.
Within-industry reply rate variance is driven by four variables: ICP precision (trigger-based vs static filter), first sentence specificity, email length (target 60–90 words), and CTA friction (15-min call not demo).
Seasonal timing within each vertical matters: accounting avoids Jan–Apr, e-commerce avoids Nov–Dec, manufacturing avoids December. Launching in low-responsiveness windows artificially depresses benchmarks.
Interpret your reply rate in the context of your specific vertical and infrastructure quality — not against a single universal benchmark number. A 1.5% reply rate in healthcare enterprise outreach may represent strong performance; the same rate in SMB SaaS outreach suggests a fixable problem.
Frequently Asked Questions
What is a good cold email reply rate by industry in 2026?
Varies significantly: Recruiting/staffing 4–8% average; B2B SaaS (SMB) 3–6%; marketing agencies 3–6%; IT/MSP 3–5%; financial services 2–4%; manufacturing 2–4%; enterprise SaaS 1–3%; healthcare 1–2%. All benchmarks assume well-configured infrastructure (pre-warmed inboxes), verified lists, specific copy, and appropriate timing. Fresh unwarmed inboxes cut these numbers roughly in half across all industries.
Why is my cold email reply rate lower than industry benchmarks?
Three most likely causes: (1) Infrastructure — open rate below 20% means emails aren't reaching the primary inbox. Check Postmaster Tools; replace with pre-warmed inboxes if reputation is below Good. (2) ICP precision — broad targeting (no trigger filters) consistently produces bottom-quartile rates. Add trigger-based filters (recent funding, leadership changes, job postings). (3) Copy — first sentence is generic, email is over 100 words, or CTA is a demo rather than a 15-minute call. All three move reply rates 1–3 percentage points when fixed.
What industry has the highest cold email reply rate?
Recruiting and staffing consistently produce the highest reply rates — 4–8% average, 8–12% top quartile. The combination of high pain intensity (hiring urgency), decision makers who respond to direct outreach, and a transactional mindset produces strong responsiveness when the outreach is specific. Real estate and IT/MSP services also score above average, both driven by clear, acute pain that specific cold email addresses effectively.
How does pre-warmed inbox infrastructure affect cold email reply rates?Consistently produces 2–4x reply rate improvement across all industries by raising primary inbox placement from 40–60% (fresh inbox) to 94–96% (Litemail pre-warmed). More emails landing in the primary inbox means more prospects seeing the message, higher open rates, and more replies on identical copy and lists. In campaigns we've tracked at Litemail, the infrastructure change alone — with no other campaign modifications — produces this multiplier across every industry vertical measured.
Does industry seasonality affect cold email reply rates?
Yes — significantly for some verticals. Accounting and financial services reply rates are lowest during Jan–Apr tax season. E-commerce brands are hardest to reach in Nov–Dec holiday peak. Manufacturing slows in December during plant shutdowns. Launching campaigns in the lowest-responsiveness window for your target industry artificially depresses benchmarks — timing alignment to the buying calendar can move effective reply rates by 1–3 percentage points without any other changes.
What cold email reply rate should I target in 2026?
Match the target to your industry and setup: for a well-optimised setup (pre-warmed inboxes, trigger-based targeting, specific copy), target the average range for your vertical. For SMB SaaS: 3–5%. For agencies: 3–5%. For manufacturing: 2–4%. For healthcare: 1.5–3%. Anything below the lower bound of your industry range with verified lists and specific copy signals an infrastructure problem worth investigating before further copy or sequence optimisation.
Cold Email Reply Rates | Litemail Pre-Warmed Inboxes
2–4x reply rate improvement across every industry from pre-warmed infrastructure. $4.99/inbox. 94–96% primary inbox placement from day one.
View Plans & Pricing →
Related reading:
Open Rate Benchmarks · Metrics Before vs After · GWS Reply Rate · Improve Open Rate · Campaign Audit